
Grid topology
Substations + high-voltage corridors
Context for why requested load cannot be interpreted separately from transmission topology and substation infrastructure.
Wikideas1 · CC0 · source / license
Public Registry · Rev.
Open-source bulk-power transmission queue monitoring and computational load telemetry under FPA § 215, FERC Order RD26-7-000, and NERC Project 2026-02 (CLO-001-1).
The Computational Infrastructure & Grid Telemetry Initiative · Ontario, Canada
Continental observatory · grid + compute + evidence
A visual layer for the registry: electricity corridors, computing infrastructure, connection records, physical observations, and provenance brought into one research view.
Live research surface
Grid → site → evidence
358.7 GW
Row-level capacity audited
1,540 published facility/request rows ≥ 100 MW across nine RTOs/ISOs
394.6 GW
Expanded known capacity scope
1,623 known ≥ 100 MW requests/records, including 83 MISO requests (35.9 GW) held outside the row-level table because public location fields are incomplete
85.0%
Rows tagged as storage
Explicit BESS token in project name or technology code
99.9%
Developer identity unresolved
No name match to a known public hyperscaler or colocation operator
Coverage note — All nine organized wholesale markets that publish a public interconnection/connection queue are live here — PJM, ERCOT, SPP, MISO, CAISO, NYISO, and ISO-NE in the U.S., plus IESO in Ontario and AESO in Alberta — but their public files are not equally complete. CAISO's core source is its Cluster 15 request list, not CAISO's whole queue. MISO withholds state, county, and technology for its newest requests, so 83 live MISO requests (35.9 GW at the 2026-09-19 capture) are preserved separately outside the row-level table. The registry now also preserves a supplemental public-evidence layer covering utility large-load queues, regulatory filings, connection applications, permit inventories, planning forecasts and other official sources beyond the nine market feeds. These supplemental measures are not automatically additive because populations and vintages can overlap. “Continental” still describes the nine-market core; see the supplemental evidence layer and Methodology → Geographic coverage.
Across these sources, … facilities (… GW) carry both an unresolved developer identity and no storage/BESS signal in their project name or technology code — the broad ambiguous research pool this registry surfaces. This pool is not 141 confirmed load discoveries: some records require explicit source-level load-versus-generation classification before they can enter the strict discovery workflow (NYISO's Load Projects, AESO's Data Load and Industrial Load). Filter Entity Classification to anything other than "Confirmed" to find them, or look for the amber tag in the table below. Being in this tier is not a finding about any specific facility; see Methodology for what "unresolved" does and doesn't mean.
Method boundary — The core interconnection registry is North American public-evidence coverage. It is an independent public-evidence accounting/observability layer for publicly evidenced large compute/load and associated entities; it is not a formal AI 2040 Phase 1 implementation or a bilateral U.S.–China verification system. Its records come from public queue, utility, permit, regulatory, operator and related evidence; a genuinely covert project could avoid those signals. The defensible capability claim is to raise the cost of hiding and map the ambiguous middle, not to claim discovery of every secret facility. See the queue vs. satellite / permit blind-spot note.
Scope boundary — The nine-market core is North America only. It is useful for the Phase 1 question of how much publicly evidenced large compute/load exists and who is associated with it, but it does not by itself provide the bilateral U.S.–China visibility that an international Track 3 verification regime would ultimately require. The evidence is public by construction: queue records, utility/service records, permits, regulatory material, operator disclosures, satellite observations and other publicly accessible sources. A genuinely covert project would try to avoid those signals. The honest claim is therefore that this registry can raise the cost of hiding and map the ambiguous middle; it is not a system that can independently discover every secret facility.
Historical snapshot archive
1,802-record registry snapshot · September 24, 2026
The current registry remains a point-in-time view of the latest accepted data. This separate snapshot preserves the earlier 281-record PJM cohort and the full 1,802-record publication for auditability; archived rows are not mixed into current totals.
Evidence board
Three visual lenses complement the registry: the transmission system, the physical compute environment, and the evidence chain that connects public records to observable infrastructure.
Context for why requested load cannot be interpreted separately from transmission topology and substation infrastructure.
Wikideas1 · CC0 · source / license
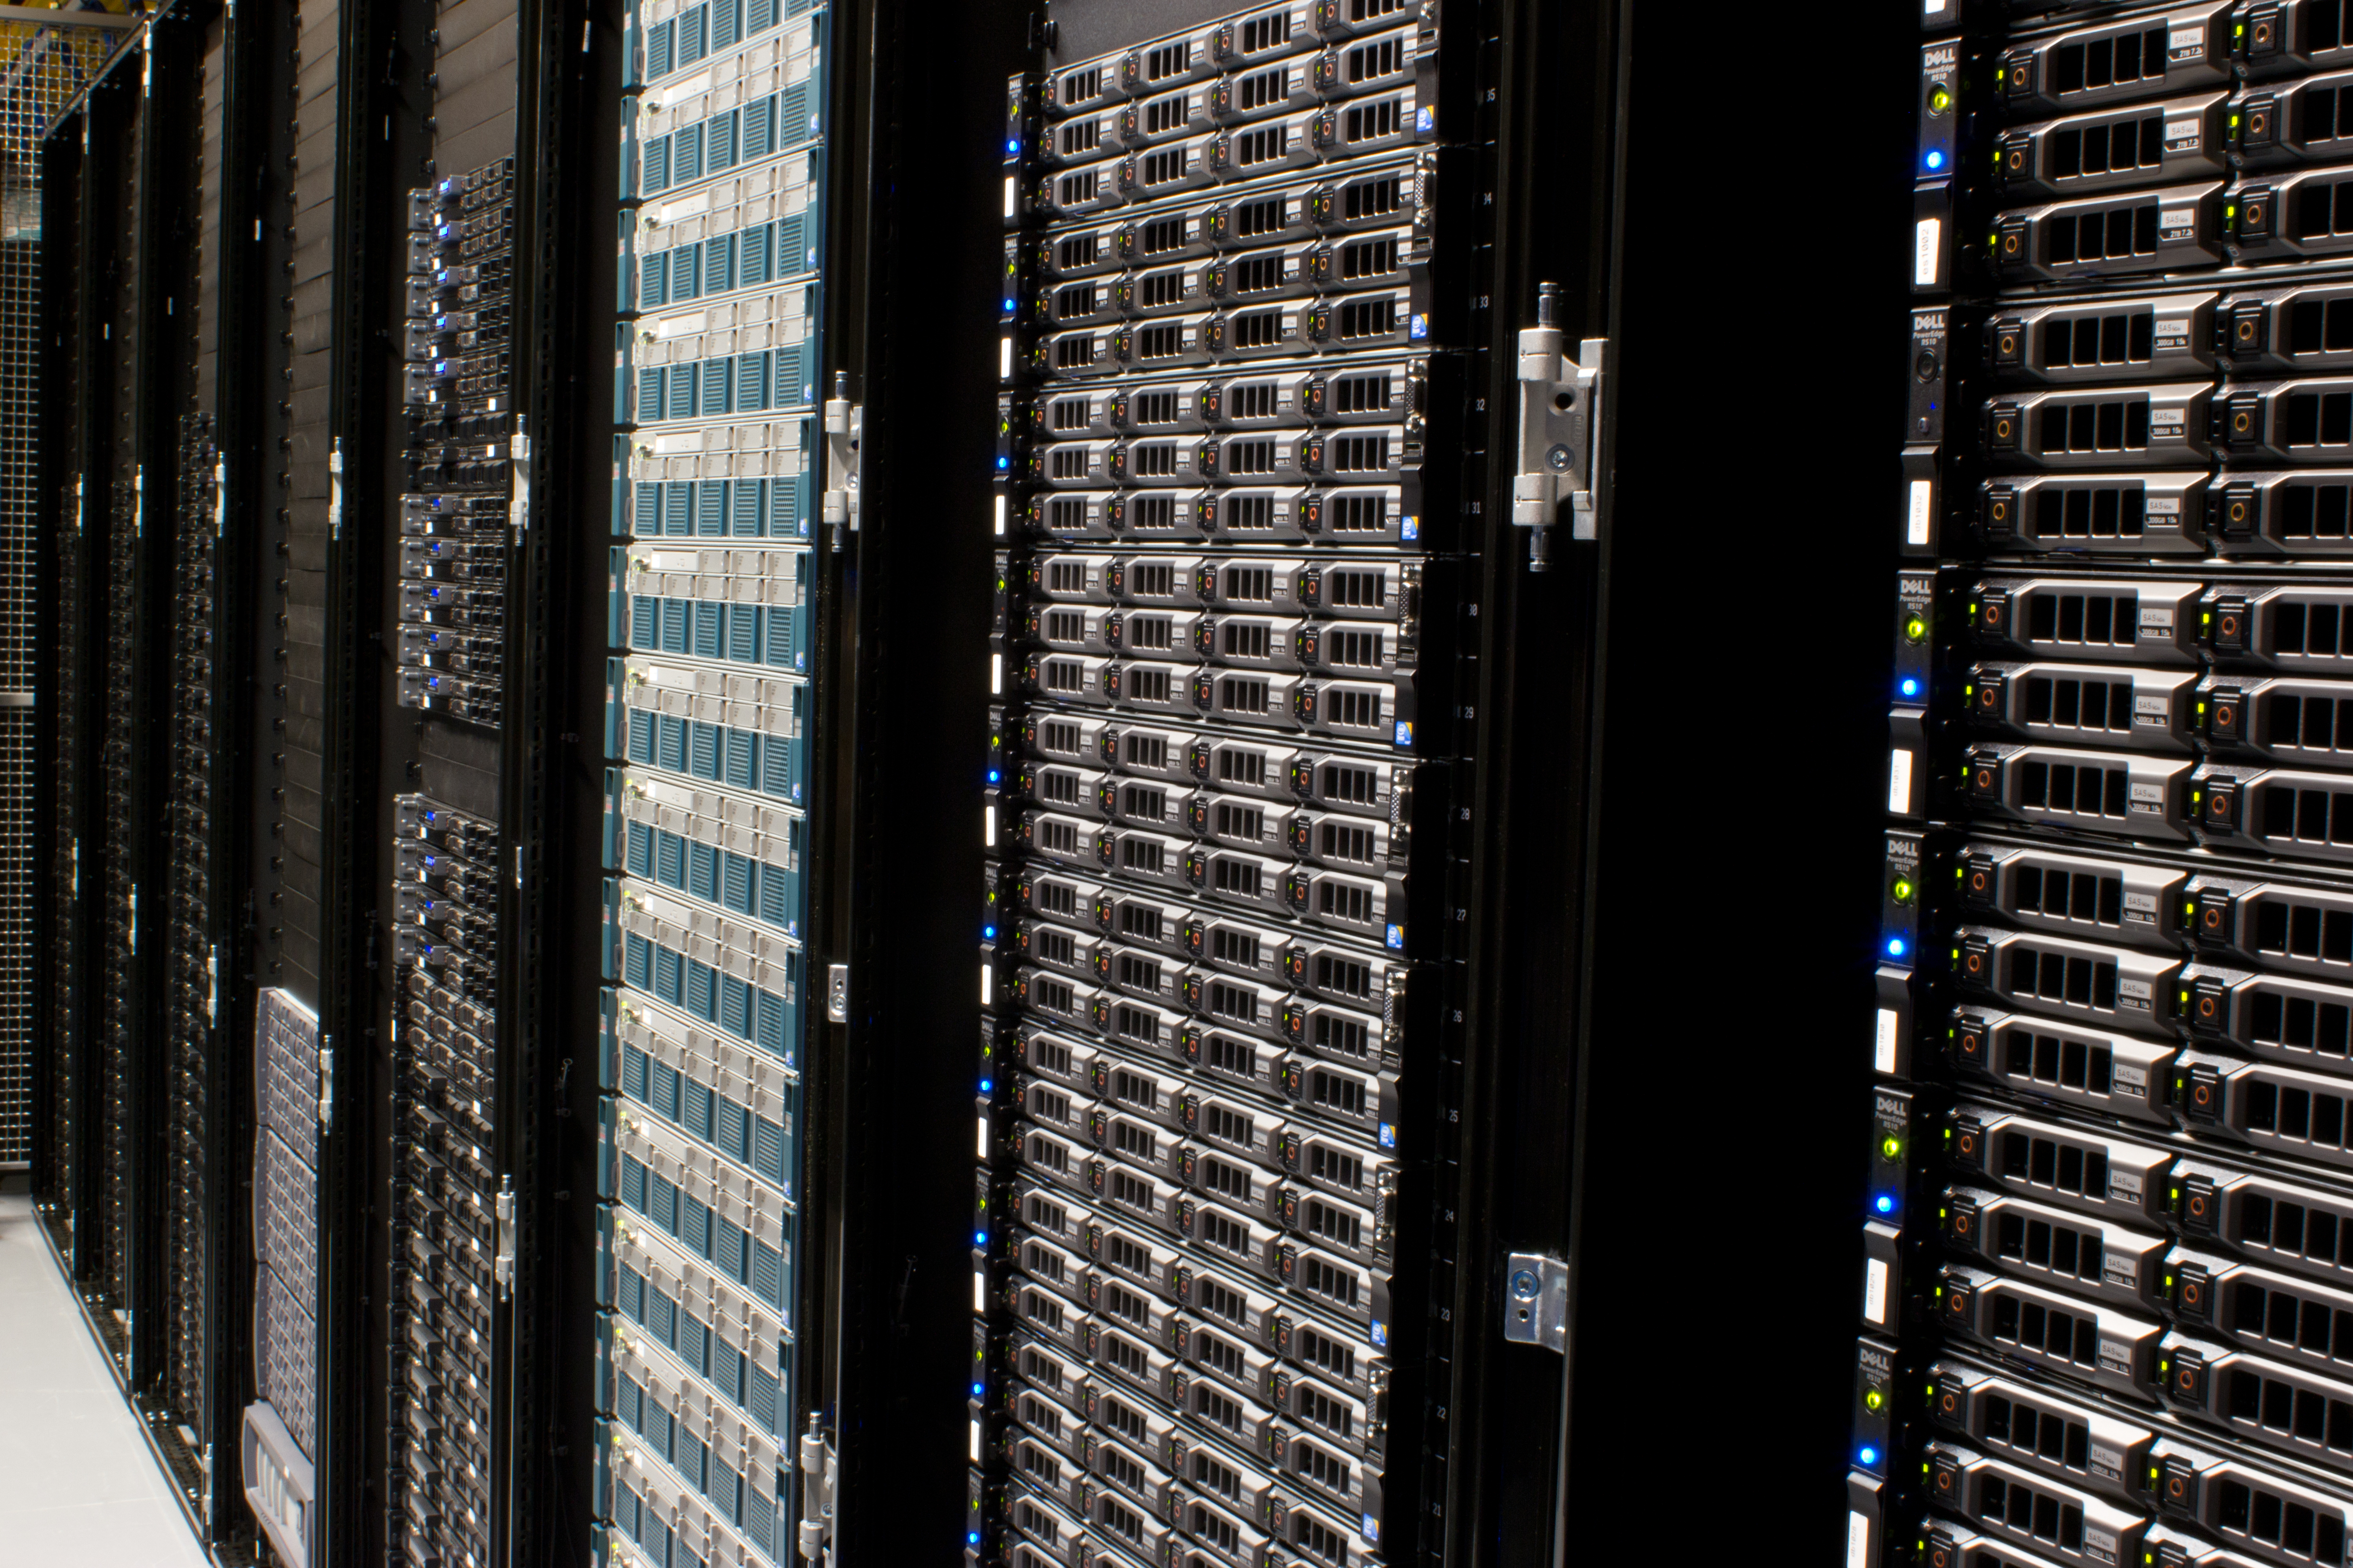
Server racks are the physical end of the chain: useful context, but not by themselves evidence of a specific tenant, model, or compute load.
Victorgrigas · CC BY-SA 3.0 · source / license
Independent streams converge on the same site without collapsing different evidence classes into one claim.
Market coverage
Coverage status
This table distinguishes published coverage from unresolved public-data gaps. “Partial” means the repository has source-level or project-level evidence but the public source does not yet expose a complete enumerated facility universe.
| Market / layer | Status | What is actually published | Current blocker |
|---|
MISO unresolved geography
These records remain in the current MISO queue snapshot and research worklist, but the public response used here does not expose enough location fields to create defensible facility pins. They are searchable below instead of being silently omitted.
153
Unlocated ≥100 MW records
2,997
MISO queue records ≥100 MW
3,873
Current MISO queue records
| Queue ID | MW | Status | Queue date | Study cycle | Why unlocated |
|---|
Map accounting
Every overlay is accounted for separately. Project pins are not automatically the same thing as queue rows, and aggregate footprints are never presented as facility locations.
271
Project records
271
Project records mapped
66
Aggregate/historical footprints
93
Epoch AI site observations
61
Supplemental evidence units
128 / 25
BPA records / mapped
| Layer | Records | Mapped | Geometry / treatment | Status |
|---|---|---|---|---|
| Project-level evidence | 271 | 271 | Project/city/county/site-area/service-area display geography | All project records display-mapped; service-area points are not facility coordinates |
| Aggregate / historical evidence | 66 | 66 | Regional/county/state footprints | Non-facility evidence; includes MISO 153-record gap footprint |
| Supplemental evidence universe | 61 | Not separately mapped | Source/evidence records, not all geographic | Searchable evidence layer |
| Epoch AI sites | 93 | 93 | Public-address-derived site display points | Separate secondary evidence layer |
| MISO complete queue | 3,873 | Not separately enumerated | Queue geometry where location is public | Current snapshot present |
| SPP active queue | 3,076 | Not separately enumerated | Queue geography | Current snapshot present |
| CAISO complete current queue snapshot | 2,278 | 1,391 ≥100 MW | Official CAISO workbook | Current snapshot ingested; historical cluster series remains separate |
| NYISO complete queue snapshot | Not captured | Not captured | Official NYISO workbook | Live retrieval adapter active; no stale snapshot is substituted |
| PJM current Cycle Service Request snapshot | 9,263 | Not separately enumerated | Official PJM public status/API | Live retrieval adapter active; public page reports 1,792 current cycle rows before export/API filtering |
Source-universe / coverage layer
Every Epoch site is routed to the relevant grid, queue, utility or national connection system. Site-specific queue IDs are only attached after an identity match is defensible.
93
Epoch sites
77
U.S. sites with jurisdiction
2
Verified site-level queue IDs
0
Current open U.S. site-specific gaps
The original 72-site U.S. jurisdiction-only gap is preserved as a starting benchmark. The current audit now assigns all 93 Epoch sites an explicit research disposition: verified queue ID, site-level public evidence, researched-no-public-record, or a genuinely still-open source acquisition task. A no-public-record outcome is not a claim that the site lacks grid service.
93-site Track 3 research queue
Every canonical Epoch AI site has a machine-readable connection-research target: jurisdiction, current site-specific evidence state, queue ID when verified, source family to search next, and the exact next research action.
93
Canonical Epoch sites
2
Site-specific queue IDs verified
2
Public service/contract matches
0
Open U.S. site-specific gaps
16
International connection targets
| Research state | Sites | Meaning | Map treatment |
|---|---|---|---|
| Site-specific queue verified | 2 | Public queue ID is tied to the Epoch site identity | Verified target ring |
| Public service / contract verified | 2 | Public utility/regulatory evidence exists without a verified queue ID | Evidence target ring |
| Public customer planning record | 1 | Named public customer/service planning record exists | Planning target ring |
| Queue jurisdiction mapped — site ID not verified | 0 | Current open state after the completed 93-site search; terminal researched-no-public-record cases are separated rather than left here | Current open research target |
| Country connection system mapped | 16 | International site has a named connection system but no site-level public queue ID | Dashed target ring |
Coverage accounting
This table separates actual project extraction from aggregate or process-only evidence. “Not public” means the operator has not exposed the per-project field needed for a defensible row; it does not mean the projects do not exist.
| Market / source family | Current state | Project records | Aggregate / historical | Public-data limit |
|---|---|---|---|---|
| CAISO | Historical clusters + current C15 | Not separately enumerated | 435 historical + C15 subset | The current public queue snapshot is complete; historical cluster/serial workbooks still require continued version-by-version ingestion and crosswalk. |
| MISO | Core + 83 excluded requests | Not separately enumerated | 83 / 35.9 GW | Captured public response lacks required site-location fields. |
| PJM | Core + service history + LAS | Not separately enumerated | 81 / 13.6 GW Cycle 1 + historical submissions | Public Large Load Registry is not yet a complete per-project public load table. |
| ERCOT | Core + Batch Zero + pipeline | Not separately enumerated | 410.6 GW aggregate pipeline | Completed RIOO verification responses are not a complete public table. |
| SPP | Core + HILL/HILLGA process | Not separately enumerated | Process/source evidence | No complete public customer-level HILL list. |
| NYISO | Named load crosswalk + Gold Book | 21 | >11.9 GW regulatory aggregate | Not every current load request is site-matched. |
| ISO-NE | Forecast records + study source | 2 | Not separately enumerated | Full study/service-stage ladder is not public. |
| AESO | All 28 Data Load rows named | 28 | Not separately enumerated | Commercial customer/proponent remains undisclosed where omitted. |
| IESO / Ontario | Load applications + CCIM context | 6 | 2,074 application universe | Detailed technical records can be confidential. |
| Outside organized markets | Utility/regulator project layer | 142 | 53 supplemental evidence units | Utility disclosures and overlaps vary by provider. |
Track 3 evidence assertions
The 93-site target layer is backed by discrete source assertions where public evidence exists. One site can have multiple assertions; these are evidence records, not additional facilities.
102
Discrete site-level evidence assertions
93 / 93
Sites with at least one evidence assertion
3
Explicit NO PUBLIC RECORD
0
Sites still requiring site-specific search
Evidence confidence and source type are retained item-by-item. A source assertion that identifies a utility relationship, contract, facility or planning record is not silently promoted to a formal interconnection queue ID.
Track 3 · regulatory / utility evidence
Primary commission, utility, ISO/RTO and system-operator sources are cataloged separately from the core queue. A source-family record is not treated as a site match unless the public record identifies the physical facility or connection.
93
Epoch sites in scope
65
Sites with utility/regulatory-style evidence
24
Primary source records cataloged
14
Checklist categories
| Checklist item | Status | Current coverage | Primary source families |
|---|---|---|---|
| Loading regulatory evidence checklist… | |||
Current-source control snapshot: 2026-09-27 public market context. It records the current publication state of CAISO, MISO, PJM, ERCOT, SPP, NYISO, ISO-NE, AESO, IESO, BC Hydro, Hydro-Québec, Manitoba Hydro and selected utility-level connection sources.
“FOUND” indicates an authoritative source record exists in the catalog. “PARTIAL” means public evidence exists but the source does not expose a complete site-level universe. Confidential studies, customer agreements and anonymized commission filings remain explicitly non-public where applicable.
Self-audit · 2026-09-27
Every major user-facing section is mapped to a populated dataset, generated interface, or explicit source-limited state. No blank field is silently treated as zero, absence, or verification.
| Section | Status | Backing artifact | What is populated / bounded |
|---|
Dated source-control layer · 2026-09-27
A dated control-plane view of what the principal public connection systems currently publish and what remains source-limited. This does not substitute for row-level records.
| Source | Current status | What is public now | Open source boundary |
|---|---|---|---|
| Loading current source context… | |||
Track 3 · physical verification
Remote-sensing and footprint acquisition are now first-class Track 3 evidence streams. The repository retains compact derived measurements, scene provenance and current building polygons while keeping full source rasters external. Construction chronology, construction-to-power timelines, permits, cooling observations and transformer events remain separate evidence classes.
93
Epoch sites
93
Construction timelines
93
Construction → power timelines
2
Cooling snapshot sites
631
Derived satellite observations
3
Transformer events
117,479
Building polygons
| Physical-verification item | Status | Current coverage | Sources |
|---|---|---|---|
| Loading physical verification layer… | |||
The acquisition workflow now reads public raw COG windows from Sentinel-2, Sentinel-1 and Landsat Collection 2 ST scenes and stores compact, site-specific derived metrics plus scene provenance. Full rasters are deliberately not committed to Git. Optical non-vegetated/NDVI values are coarse campus-change proxies; Landsat thermal values are surface-temperature/local-background metrics; Sentinel-1 values are VV/VH backscatter metrics. None is treated as proof of compute activity by itself.
Transformer procurement/delivery/installation evidence remains a separate source-backed event ledger. Current source-backed records are retained without filling unknown manufacturer, model, rating or date fields. The 93-site transformer research queue remains active; missing events are not evidence that transformers are absent. Current building polygons are geometry evidence only and do not establish AI tenancy.
Full machine-readable project layer
Browse all 271 extracted project-level records in the page itself. Search matches project name, customer, provider, jurisdiction, queue ID, permit number and status. Capacity cells show the first source-specific claim only; open the JSON/CSV for every retained raw claim. **All 271 project records have display geometry; service-area and jurisdiction points are explicitly labeled where an exact site is not public.**
| ID | Project | Customer / developer | Provider | Jurisdiction | Capacity claim | Status | Source |
|---|---|---|---|---|---|---|---|
| Loading… | |||||||
Full 93-site Track 3 target layer · every connection field accounted for
A compact research observatory for every canonical Epoch site. Published values stay visible; unavailable public fields are explicitly marked NOT PUBLICLY RETAINED rather than appearing as unexplained blanks. Open a row to see the full connection record, source evidence and research trail.
| Site | Connection state | Grid / jurisdiction | Provider | Queue / capacity | Evidence | Research trail |
|---|---|---|---|---|---|---|
| Loading… | ||||||
102 discrete evidence assertions
Browse every preserved Track 3 site-level utility, facility, contract or planning assertion underlying the Epoch connection-target layer. Multiple assertions can refer to the same physical campus.
| Site | Evidence type | Authority | Record / assertion | Capacity | Confidence | Source | Next action |
|---|---|---|---|---|---|---|---|
| Loading… | |||||||
CAISO · complete public queue
The daily CAISO sync downloads the official public XLSX and preserves all three published queue sheets. This layer is separate from the conservative large-load registry and is used directly by the map.
Loading
Queue records
Loading
Records ≥100 MW
Loading
Rows with county + state
Not loaded
Latest snapshot
Loading the daily CAISO snapshot…
Fresh public evidence
An additive evidence ledger now captures newly verified public facts for the 93-site frontier-AI reference universe. These records do not overwrite Epoch values or manufacture queue IDs.
454
Fresh public findings
61
Sites touched
93
Sites in merged view
214
Effective publisher fields still unresolved
Global AI data-center coverage
The repository mirrors all current Epoch AI explorer records available in its directory, then keeps independently discovered facilities and programs separate until identity, source, capacity scope and overlap are verified. “100% captured” here means 93 / 93 current Epoch records, not 100% of every AI data center on Earth.
93 / 93
Current Epoch records captured
44%
Epoch's published global AI-compute coverage reference (2026-09-09)
4
Independent discovery universes
33
External candidates/programs queued
| Chip owner / scope | Coverage | Reference | Interpretation |
|---|---|---|---|
| Loading current coverage ledger… | |||
External discovery
Loading…
Why this stays separate
External indexes overlap with Epoch, may include cloud regions, programs, phases or power assets, and use different inclusion rules. Candidates therefore enter a research queue first. They are promoted into the canonical 93-site frontier layer only after source-backed entity resolution and duplicate/overlap checks.
Sources: Epoch AI; AI Data Center Index; Data Center Index; Compute Atlas. All external discovery counts are comparator/discovery universes and are not summed.
Auxiliary public sources
Raw publisher captures are retained and the normalization workflows are wired to materialize row-level public datasets. Source failures remain explicit rather than becoming empty universes.
5
Auxiliary source families
4
Raw captures retained
5
Normalization workflows
1
Separate official-source gap (NYISO)
Research backlog
214 open research tasks: 214 publisher-field gaps and 0 open Track 3 domain cells across all 93 sites. The separate observation queue contains 24 physical acquisition tasks. These are explicit research states, not inferred absences.
Open the live work queue →Queue-wide overlays
CAISO, MISO, NYISO and SPP are ingested into separate machine-readable queue universes; PJM's complete Cycle Service Request universe is separate as well. BPA load requests are retained as a separate non-RTO/ISO layer. These layers are map/audit overlays and are not summed into the core large-load capacity.
3,873
MISO queue rows
3,076
SPP active rows
Not captured
NYISO queue rows
9,263
PJM cycle rows
live
Automated refresh
Satellite acquisition coverage: 93 / 93 Epoch sites now have explicit Sentinel-2, Landsat optical/TIRS, and Sentinel-1 acquisition targets. The site still reports 0 processed satellite measurements until scenes are actually acquired and derived metrics are generated. Coordinates retain their recorded source precision and are not silently promoted to exact facility coordinates.
Each layer is retained separately with its source row and normalized fields. Snapshot status is factual repository state; missing local snapshots are treated as unavailable rather than synthesized. See queue layer status.
| Provider | Evidence type | Records | Capacity / measure | Date | Accounting |
|---|---|---|---|---|---|
| Loading complete evidence universe… | |||||
From source units to discrete records
This layer turns public source material into individually identifiable permit, utility-customer, contract and distribution-connection records where the evidence exposes a discrete project. It does not add these records to the 1,540-row core total.
271
Project-level records
33
Virginia DEQ permit records
—
BPA dedicated-layer rows
28
AESO data-load projects
| Project / record | Provider / source | Location | Raw capacity evidence | Record status |
|---|---|---|---|---|
| Project Camellia | Georgia Power + Georgia PSC | Effingham County, GA | 3,200 MW / 3,210 MW (separate dated primary claims) | Contract approved / announced |
| River Bend AI data center campus | Entergy Louisiana | West Feliciana Parish, LA | 330 MW utility / 245 MW critical IT / up to 1,000 MW utility scale | Under construction |
| Vaughan MTS #6 | Alectra Utilities | Vaughan, ON | 108 MVA current page / 125 MVA 2025 filed plan | Planned 2027 |
| SB Energy — Piketon data center | AEP | Piketon, OH | 10 GW campus at buildout | Planned |
| CAISO LC24 / serial loads | PG&E + CAISO | San Jose / Gilroy / Mission / De Anza | 11 LC24 loads / 840 MW + 3 serial loads / 700 MW | Study records |
| Virginia issued data-center permits | Virginia DEQ | Multiple Northern Virginia / statewide sites | No uniform customer MW field in listing | 33 individual permit records extracted |
The supplemental evidence file count is loaded from the machine-readable public dataset. The map also contains aggregate geographic evidence footprints; footprints are not facility locations. The machine-readable file preserves raw claims and source dates. The interactive map overlays every record present in `data/project_level_map.json`; their geometry is county/town/site-area display geography. Empty capacity fields mean the cited public record did not publish a usable project MW value; the registry does not infer one from unrelated generation, tariff or IRP figures.
Machine-readable project universe
All individually extracted records are searchable here. The browser preserves record type, location, provider, status, raw capacity claims and primary/secondary source links without adding them to the core queue total.
| Project / record | Type | Jurisdiction | Provider / customer | Queue / permit | Capacity | Status | Source |
|---|---|---|---|---|---|---|---|
| Loading… | |||||||
PJM historical / current utility evidence
PJM's Load Analysis Subcommittee posts utility large-load and data-center forecast submissions separately from its generation interconnection queue. This catalog preserves the public 2025–2026 material trail without turning document entries into invented facility rows.
28
Public material entries
2025–2026
Covered history
2
Historical submission years covered
The 2026-09-24 material set includes Dominion, NOVEC, Rappahannock, ODEC, PPL, AEP, Duquesne, FirstEnergy, Exelon, Dayton AES, Duke and PSEG; the 2025 material set contains the utility submission trail including Dominion, NOVEC, REC, Exelon, Duquesne, AEP, PPL, FirstEnergy, SMECO, ODEC, DAY-AES, Duke and PSE&G.
Beyond the nine queue feeds
The core registry is deliberately conservative: a number is only counted in the row-level table when it can be represented as a published facility/request row under the current schema. This companion layer preserves additional public utility, regulator, planning, connection, permit and large-load evidence that would otherwise disappear.
61
Supplemental evidence units
153
Current ≥100 MW MISO rows needing site resolution
70 GW
Dominion aggregate large-load queue evidence
6.9M
Ontario CCIM data points
| Jurisdiction / provider | Evidence | Records / units | Capacity / measure | Date | Accounting |
|---|---|---|---|---|---|
| ERCOT | Batch Zero public process / source layer | Process | ≥75 MW threshold | 2026-09-26 | Non-additive |
| MISO | Unlocated live large-load requests | 83 | 35.9 GW | 2026-09-19 | Added to expanded known scope |
| Arizona Public Service | Uncommitted extra-large-customer queue | Aggregate | 19 GW | 2026-08 | External aggregate; non-additive |
| American Electric Power | Signed large-load agreements | Aggregate | 69 GW | 2026-07-30 | Footprint aggregate; non-additive |
| AEP Ohio | Contracted new load, 2026–2030 | Aggregate | 12 GW | 2026 | Overlaps AEP/PJM; non-additive |
| AEP Ohio / SB Energy / DOE | Piketon planned data-center campus | 1 | 10 GW | 2026-03 | Named project; queue match pending |
| Ameren Missouri | Large-load growth planning envelope | Aggregate | 2 GW | 2026 | Planning envelope; non-additive |
| PacifiCorp | Large-customer service requests | Source lead | Tens–hundreds MW/request | 2025-12 | Source lead; no aggregate |
| Dominion Energy Virginia | Large-load connection queue | Aggregate | 70 GW | 2025-12-31 | Non-additive aggregate |
| ComEd / Exelon | High-probability large-load request pipeline | Aggregate | 16 GW | 2026-02-12 | Non-additive aggregate |
| Salt River Project | Large-business customer pipeline | 80 projects | 15.308 GW | 2025-09-25 | External geography; not additive |
| BC Hydro | AI/data-centre call for demand | 15 applications | ~0.8 GW | 2026-09 | External geography; not additive |
| Portland General Electric | Executed data-center contracts | 5 contracts | 430 MW | 2026-02-17 | External geography; not additive |
| Entergy Louisiana / Hut 8 | River Bend named AI data center | 1 facility | 330 MW utility / 245 MW IT / up to 1 GW | 2025-12 | Potential MISO/Epoch overlap |
| ISO New England | CELT 2026 large-load forecast | 1 data center | 200 MW | 2026 | Forecast evidence; potential queue overlap |
| New York PSC / NYISO | Regulatory large-load queue summary | 48 projects | >11.9 GW | 2026-02 | Non-additive regulatory aggregate |
| Virginia DEQ | Data-center air-permit identity inventory | 72 operating + 9 planning | Not published as uniform MW | 2026-09 | Facility identity evidence |
| Alectra Utilities | Vaughan MTS #6 data-center connection | 1 facility | 108 MVA | 2026-09 | MVA retained; no MW conversion |
| OEB | Centralized Capacity Information Map | Geospatial dataset | ~6.9M data points | 2026-04 | Grid-context evidence |
The table is intentionally not summed. These sources differ in geography, vintage, unit, stage and population definition, and several overlap the nine-market queue universe. The machine-readable artifact records the source date, granularity and overlap treatment for every evidence unit.
Aggregate and process evidence
These records preserve utility queues, regulatory aggregates, forecasts, process documents and other public evidence that cannot safely be treated as unique facility rows.
| Provider | Evidence type | Jurisdiction | Records | Capacity / measure | Date | Accounting | Source |
|---|---|---|---|---|---|---|---|
| Loading… | |||||||
Independent secondary evidence layer
The current Epoch AI dataset is preserved separately from queue-origin facts. It covers major AI data-center campuses using satellite imagery, permits, public documents, disclosures and regulatory filings. Epoch values are not substituted for interconnection capacity.
93
Epoch sites imported
13,500.2 MW
Current IT power
14.02M
Current H100-equivalents
2
Site-specific queue IDs
| Epoch site | Country | Address | Current IT MW | H100-eq | Owner / user | Grid / queue | Details |
|---|
Epoch AI states that its data are free to use, distribute and reproduce with attribution under Creative Commons Attribution 4.0. The repository stores the raw CSVs, joined timeline/chip records and generated crosswalk. A blank crosswalk is not evidence that a site is absent from the grid; it means no conservative direct match was identified in the current nine-market registry.
| Queue ID | RTO | State / County | POI substation | Capacity (MW) | Est. GPUs | 90-day FLOPs (ref.) | Entity classification | Details |
|---|
Module 1
A transparent physics, evidence-ingestion, entity-resolution, geospatial, and governance layer. The radar evaluates observable infrastructure evidence; missing evidence remains UNKNOWN or NOT INGESTED.
The 1,979 TFLOPS baseline is NVIDIA's H100 SXM FP16/BF16 peak with 2:4 structured sparsity (it equals the dense FP8 peak; the FP8 figure of 3,958 is also a with-sparsity number). Dense FP16/BF16 is 989.5 TFLOPS, which halves every bound here: at that figure 100 MW reaches only about 0.54–0.56× of 1e26 in 90 days, and about 187 MW is needed in all three scenarios. The registry keeps 1,979 because the brief specifies it; read these FLOP bounds as an upper range.
| Scenario | PUE | Rack kW | MFU | 90-day FLOPs |
|---|---|---|---|---|
| Reference | 1.25 | 35 | 40% | 1.126×1026 |
| Conservative | 1.40 | 20 | 25% | 1.099×1026 |
| Aggressive | 1.15 | 50 | 50% | 1.071×1026 |
The numerical ordering is conservative > reference > aggressive for these particular assumptions. The invariant is the interval: every scenario remains above 1.0×1026 FLOPs at exactly 100 MW.
This board separates jurisdiction coverage from site-specific evidence. A missing queue ID, telemetry stream, or supply-chain record remains a documented gap; it is never treated as evidence of absence.
Loading current optical / TIR / SAR acquisition state.
Loading current transformer-event state.
Generated for all 93 Epoch sites. These are acquisition tasks for missing evidence streams, not findings about the sites.
Program names, public owners/users, addresses, energy partners, construction/EPC relationships and grid operators are captured here when a retained public source exposes them. Uncaptured fields are explicitly marked rather than inferred.
Loading public enrichment coverage…
Source families are shown separately from ingested evidence. “Source available” means the public dataset exists and is cataloged; it does not mean the registry has imported or validated it yet.
The console is driven by the canonical Track 3 site-status artifact. It separates a verified site-specific queue record from site-level evidence and from sites that still need a site-specific search.
| Site | State | Grid / utility jurisdiction | Grid state | Epoch IT MW | Evidence | Next research action | Open |
|---|---|---|---|---|---|---|---|
| Loading… | |||||||
Module-1 five-domain gate: loading current audit summary…
Every row here cleared two filters before entering the registry: a ≥100 MW requested-capacity floor, applied at ingestion, and a training-scale check applied afterward — whether that capacity, run continuously for 90 days, plausibly clears 1026 FLOP under every scenario below, not just the reference one.
FLOPs are estimated across three named scenarios spanning a defensible range of real facility characteristics, not a single point estimate: PUE 1.15–1.40, rack density 20–50 kW, and sustained model-FLOPs utilization 25–50%, bracketing a reference scenario (PUE 1.25, 35 kW/rack, 8 GPU/rack at H100-SXM FP16/BF16 Tensor Core baseline throughput, 40% MFU). At exactly 100 MW the three scenarios land between 1.071× and 1.126× the 1026 mark — because lower PUE efficiency and lower rack density partially offset each other in this formula, which is why the boundary is reported as a range rather than a single verified fact.
GPU and FLOPs figures are illustrative order-of-magnitude estimates derived only from requested interconnection capacity — not a claim about actual hardware, and not verified against any facility's real power-to-compute conversion.
North America has nine organized wholesale electricity markets that run public interconnection queues: PJM, ERCOT, SPP, MISO, CAISO, ISO-NE, and NYISO in the U.S., plus IESO in Ontario and AESO in Alberta. All nine are ingested here, each from the operator's own published file. The files are not equally complete, and a total that mixes them should be quoted with these limits:
“Continental” in the title now spans all nine organized markets, but not utilities outside them. The … on this page combine files captured on different dates: the five most recently added (MISO, CAISO, NYISO, ISO-NE, AESO) on 2026-09-19, the others earlier in August–September 2026.
Developer names are matched against a small, hardcoded list of known hyperscalers and wholesale colocation developers by fuzzy string match, plus whole-word brand-token matching for project-specific subsidiary filings (e.g. a filing under “STACK Danville Gen Power 5, LLC” rather than the parent company name). A miss against that list means not matched to a known name — it is not evidence the entity is a shell company, and it is not evidence of anything other than the name not being one this registry currently recognizes.
This is a static, point-in-time capacity estimate, not a time-resolved load signature. A dual-layer signal — macro capacity factor over a facility's operating history, plus micro-scale power transients from synchronized events like distributed-training checkpointing — is a meaningful further direction and is not implemented here; nothing on this page should be read as a claim that it is.
Documents this registry's analysis has been submitted in support of.